The headline claim says Washington spent about $181,000 per family in poverty last year—here’s what that number actually means and why the denominator fight matters most.
Story Snapshot
- Census’ official poverty line ignores noncash aid like Medicaid, food benefits, and housing support.
- A columnist tallied $1.256 trillion in low-income spending and divided by the official poverty count.
- That math boosts the “per family” figure because the poverty count excludes much of that aid.
- Major programs like the Supplemental Nutrition Assistance Program still show measured poverty reductions.
What the $181,000 headline actually measures
Townhall reported that the federal government spent $1.256 trillion on large low-income programs in fiscal year 2025. The piece then divided that total by Census’ official poverty count to claim about $35,000 per poor person, or $181,000 per poor family. The article tied its tally to Office of Management and Budget data but did not publish the line items behind the sum. That makes the aggregation hard to audit from public links alone.
Census defines official poverty using cash income before taxes. It does not include noncash help like public housing, food benefits, or health coverage, and it does not include tax credits. When a writer divides total spending that delivers those very benefits by a poverty count that excludes them, the per-family ratio will look bigger than what any one family actually gets. That is an accounting mismatch, not proof of cash transfers at that level.
The denominator drives the drama
The official poverty measure and the Supplemental Poverty Measure count resources differently. The Supplemental Poverty Measure was built to include noncash benefits and tax credits and to subtract necessary expenses. Researchers use it to study how programs change poverty. This is why debates flare when critics use the official measure as the denominator. It is simple, but it omits much of what government gives low-income households, so ratios can mislead busy readers.
The clean way to test impact is not gross dollars divided by an official headcount. The serious test is whether programs move people above a threshold when counted as resources. On that score, several sources find measurable gains. That does not prove every dollar is well spent. It does show that resource-aware measures matter when judging results. This is basic stewardship: match the measure to the mission, then check outcomes program by program.
What the data say about major programs
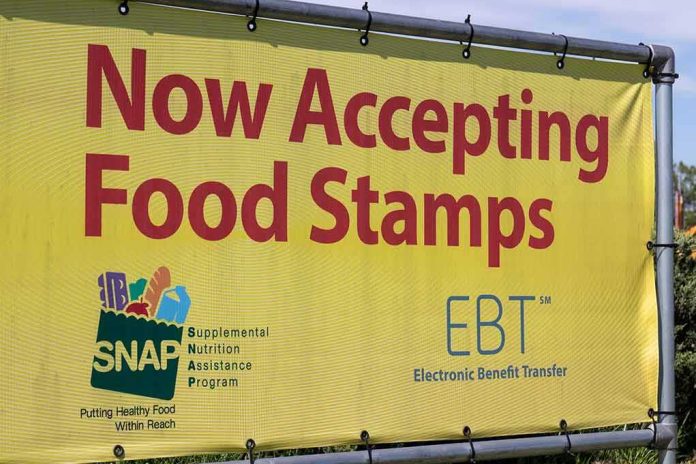
The United States Department of Agriculture reported $147.9 billion in food and nutrition assistance in fiscal year 2025, including $101.7 billion for the Supplemental Nutrition Assistance Program and a caseload averaging 42.1 million people per month. Scale like that guarantees big totals. It does not, by itself, prove failure or success. The question is whether those benefits reduce poverty depth and duration when counted.
The Supplemental Nutrition Assistance Program has documented anti-poverty effects when measured with the Supplemental Poverty Measure. A Census story found the program moved 3.2 million people out of poverty in 2018 when counted as income resources. A United States Department of Agriculture study found the program cut the depth and severity of poverty more than the headline rate, with average annual declines in depth and severity above ten percent in the 2000s. Social Security and refundable tax credits also show large measured impacts.
How a prudent reader should judge the claim
The per-family number uses a narrow denominator and an opaque numerator. That weak link weakens the rhetorical punch. A better read is this: the nation spends a lot on low-income aid; the official poverty count stays sizable; the Supplemental Poverty Measure shows many programs reduce hardship when counted as resources. The facts support pushing agencies for cleaner cross-program totals, lower overhead, and tighter integrity checks, while not ignoring measured gains for seniors, workers, and children.
Conservative common sense says demand two things at once: honest math and real results. Insist that budget compilers publish the exact program list behind any trillion-dollar claim. Require that analysts use resource-aware measures when scoring outcomes. Then press for reforms that reward work, target the deepest need, and cut duplication. That approach turns a viral headline into a roadmap: fix the unit of measure, verify the totals, and make every dollar move the needle.
Sources:
townhall.com, census.gov, ers.usda.gov